3D Image Browsers
Med 3D features two browsers that give you different ways of analysing imported images. The first, is a 3D Slice View that loads individual slices in the axial, sagittal and coronal planes into the 3D Scene, allowing you to scroll through slices in each orientation. The second, is an Isosurface Browser that gives you a preview of a 3D Mesh at individual Intensity Values selected with a slider.
The features of each browser are explained in detail below.
3D Slice View
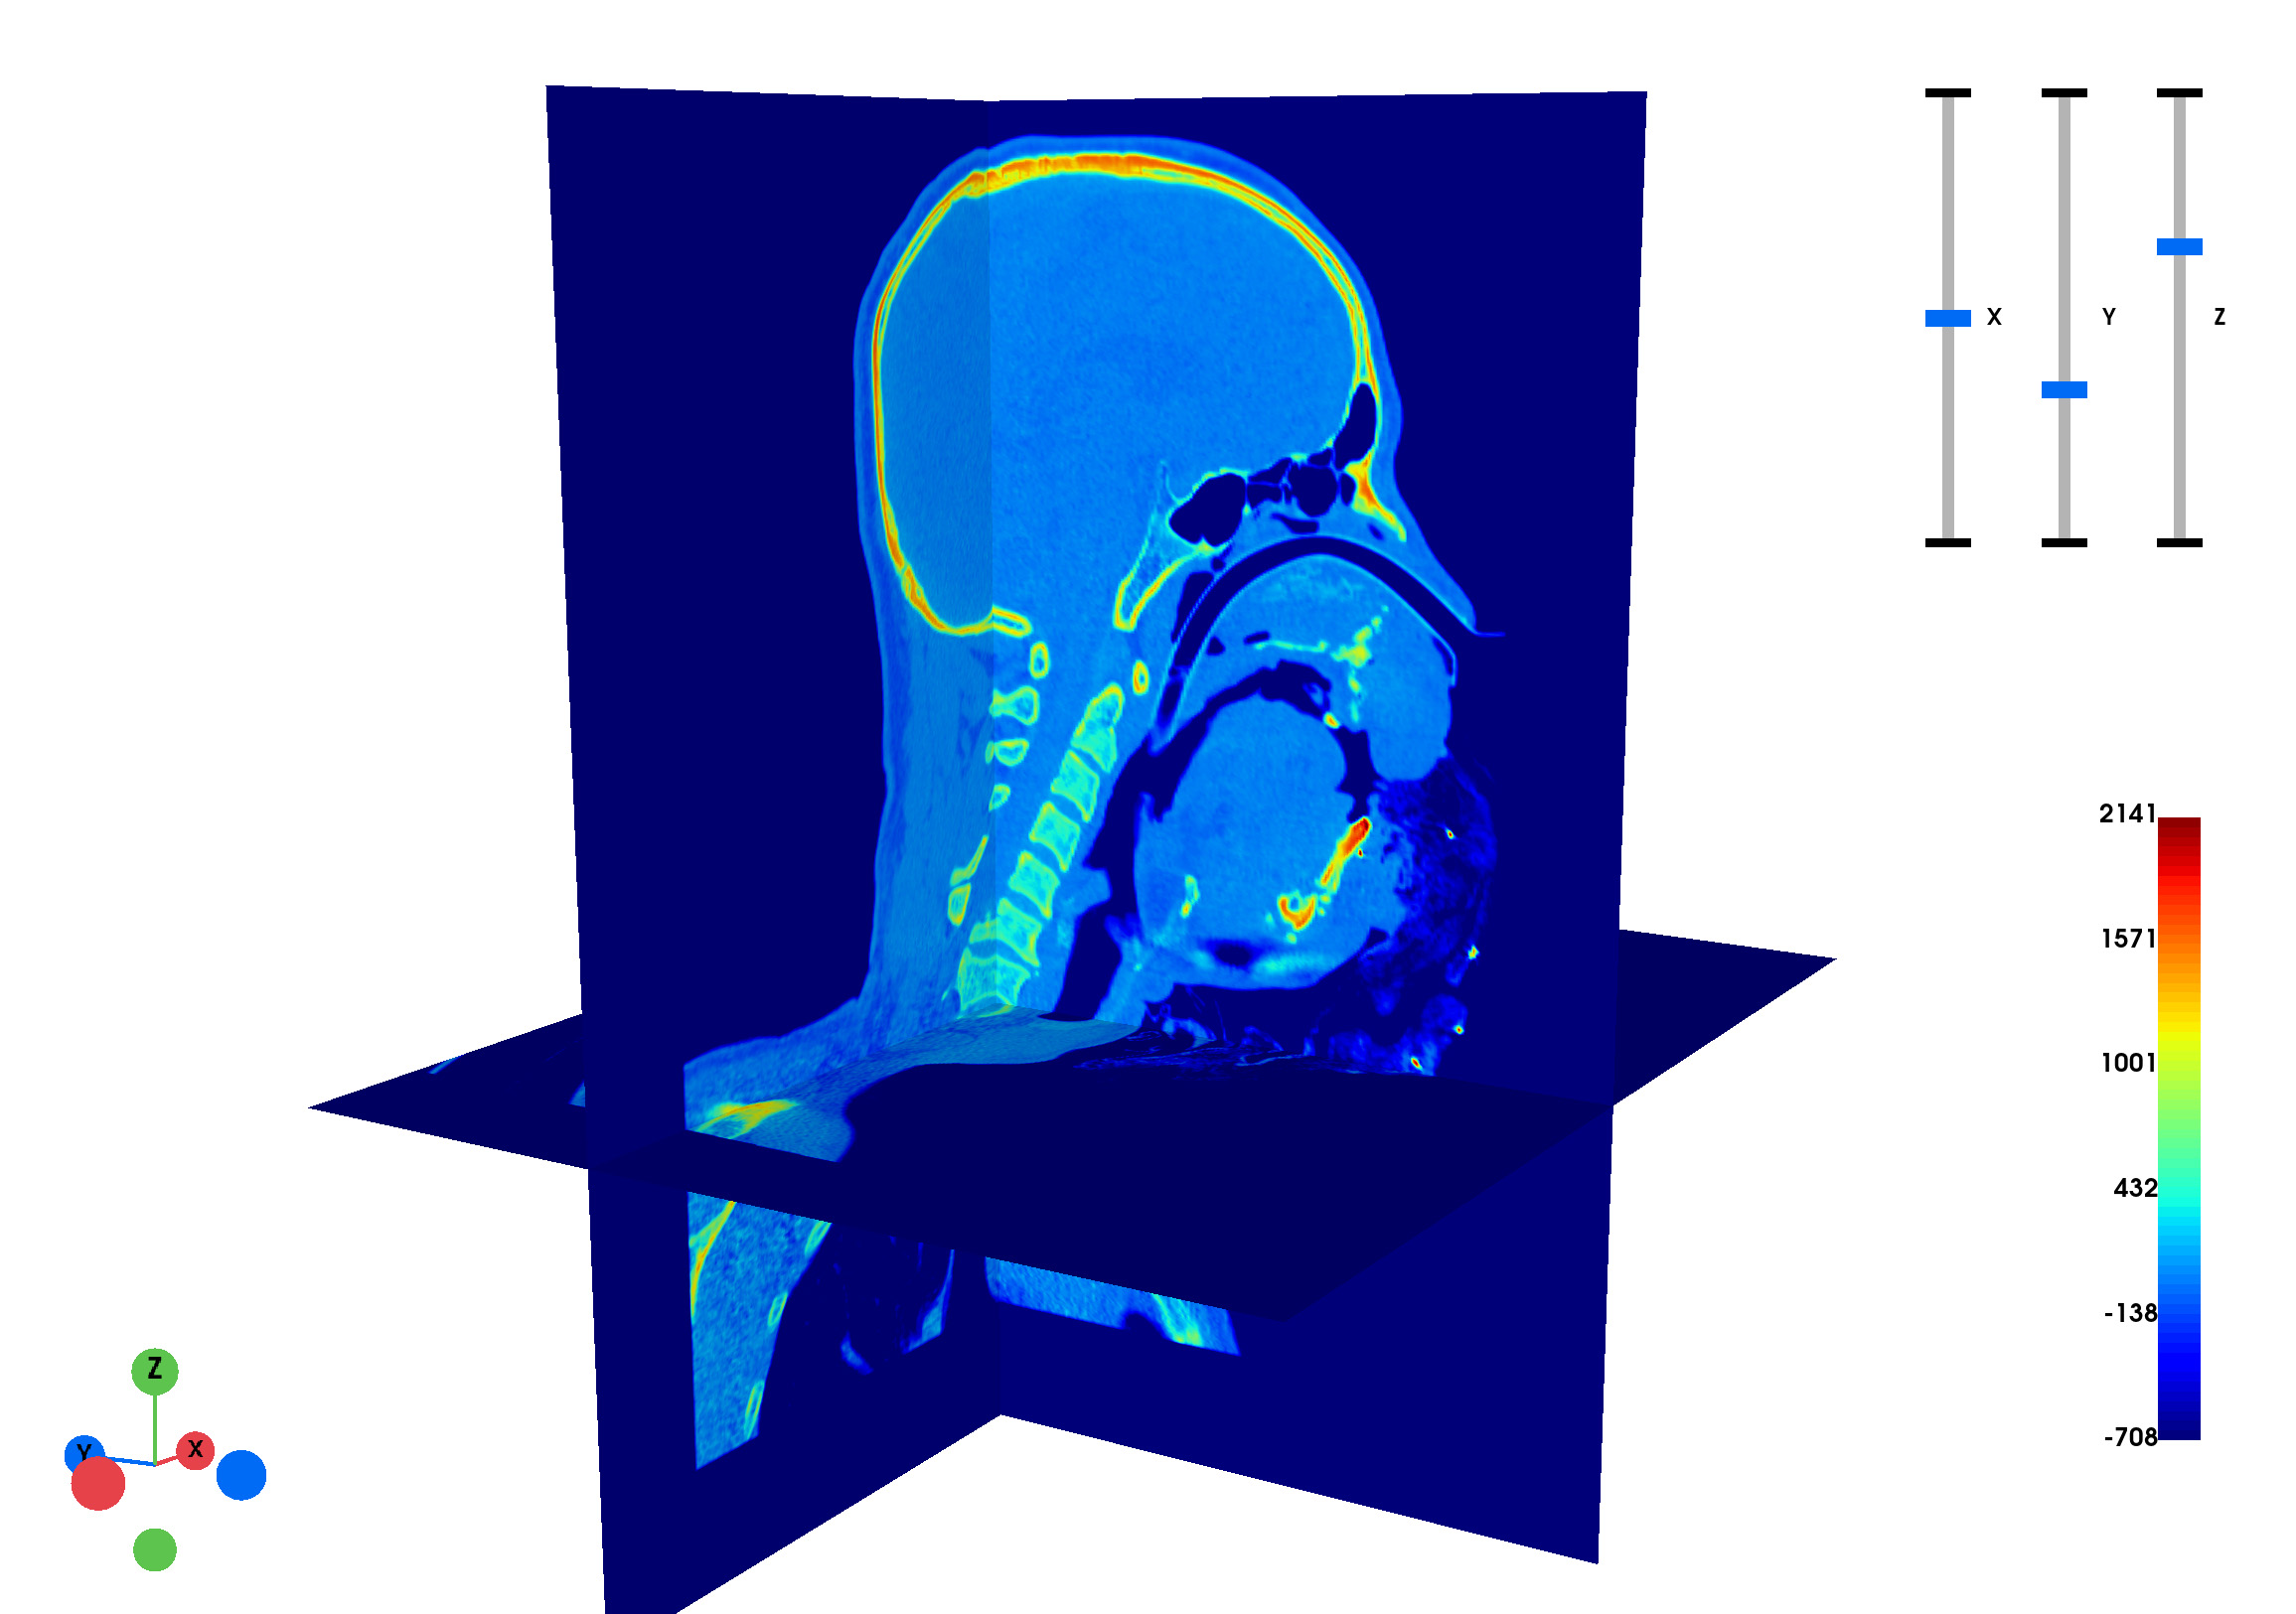
Once Dicom Images have been imported, select the 3D Slice View button to load the scene as in the image below. Slices in the Axial, Sagittal and Coronal orientations are added onto the scene, along with three sliders (X, Y & Z) in the top-right through which you can scroll through individual slices in each orientation.
The default colourmap applied to the slices is the gist_ncar_reverse colourmap, as in the image below. A scalar bar is added on to the bottom right representing the range of colours applied on the slices, as well as the Intensity Values whereby the colour transitions are set.
The orientation widget added to the bottom left gives you an indication of which direction the slices are facing.

At the top-left, four buttons are provided that you may use to control the scene.
Use the Cancel button to close the 3D Slice View, clearing the scene of all slices and widgets.
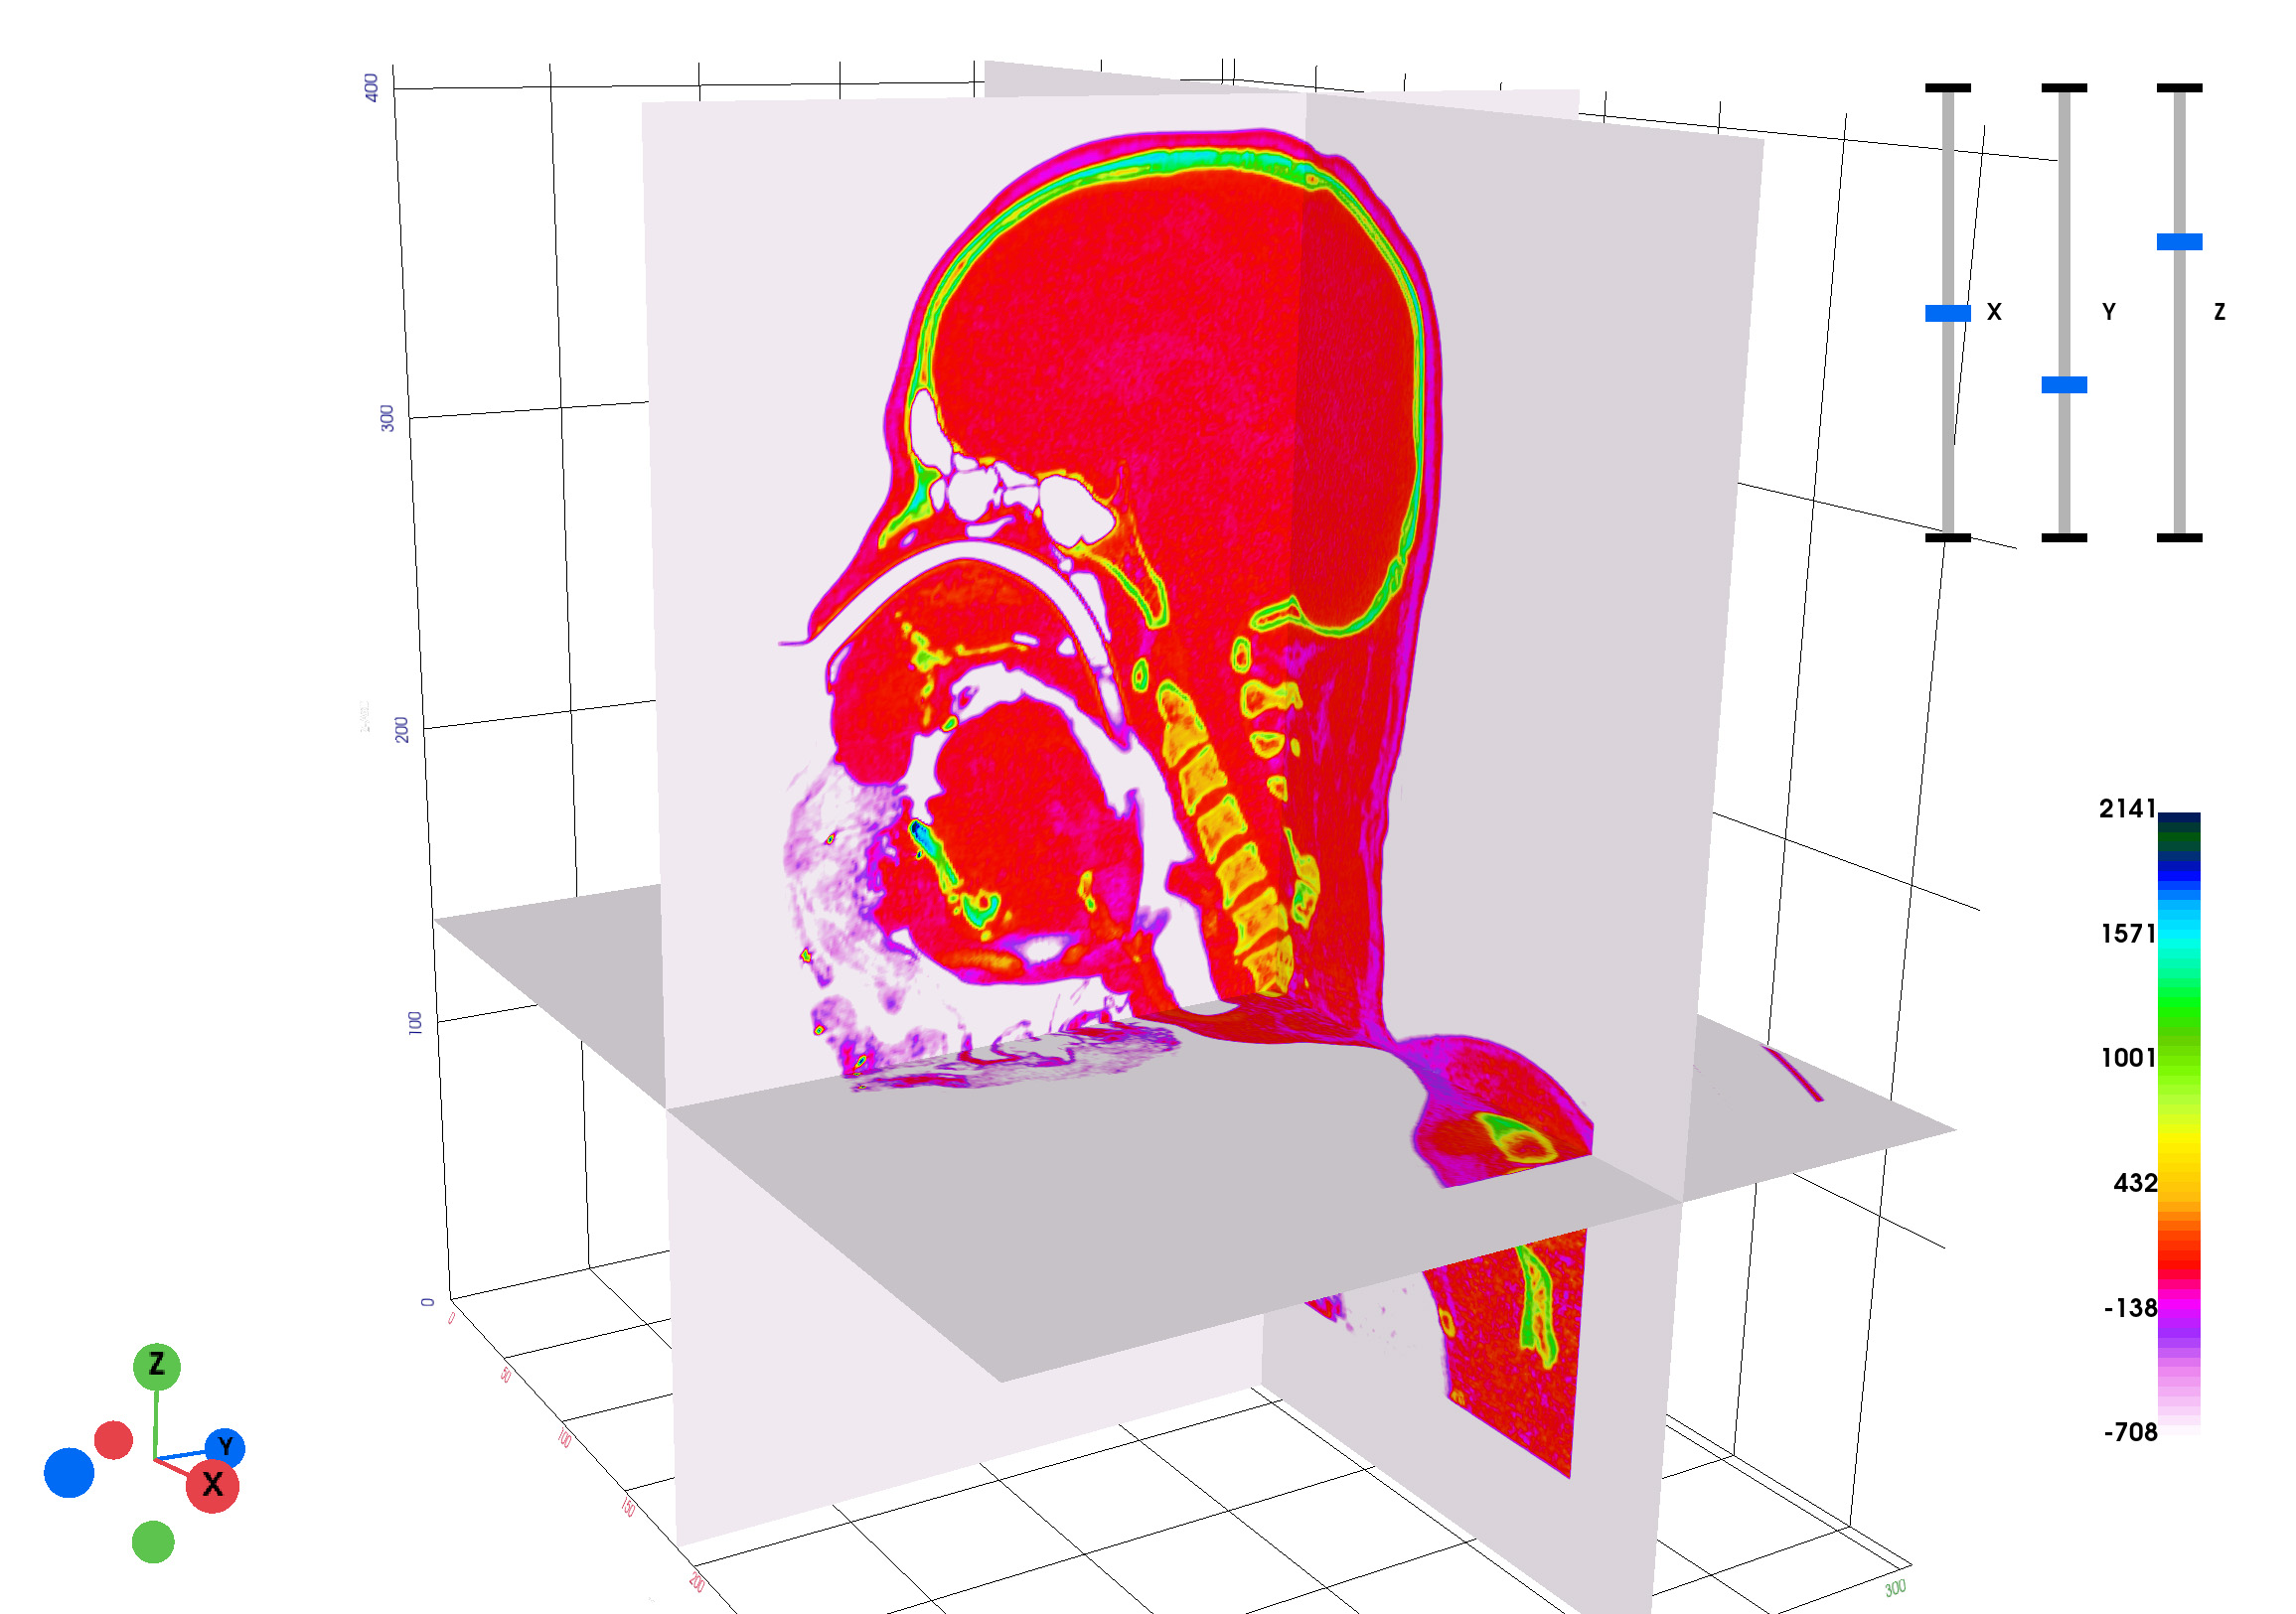
Use the Colour Wheel button to change the colourmap applied on the slices, as in the example below where it has been changed to the jet colormap.

Use the Grid button to place a 3D Measurement Grid on the slices.
Use the Generate Model button, represented by a cube, to add a 3D Model onto the scene. This model is based on Threshold values set in the Activity Bar. Under Create 3D Model, put in minimum and maximum threshold values before adding a 3D Model onto the scene.

Altogether, these options featured in the 3D Slice View, provide tools for a complete analysis of the imported Dicom Images.
isosurface Browser
Select the Isosurface Browser button, to load the scene below. A mesh is generated from a single Intensity Value. To the right, a slider is provided. Use the slider to scroll through Intensity Values, with a mesh generated on the scene at each value.
This browser, gives a great preview of the different parts of the 3D Image at a specified intensity value. Use it to analyse the distribution of values in the image, as well as what values you would use to generate a 3D Model.